This document explains the architecture of Runbook. This guide is useful for Developers looking to contribute to Runbook as well as anyone else interested in the setup and design.
Principles of Runbook's architecture
Before explaining the components of the Runbook application it is important to cover the key principles that govern architecture decisions for Runbook. You can think of these as Runbook's rules of architecture.
Be highly available
Infrastructure and Application monitoring should always be considered a critical component, as such high availability is a key requirement in Runbook's design. Runbook users rely on it to resolve issues automatically for them during their outages, if the monitoring service is unavailable to them while they are having an outage Runbook provides no use.
The monitoring service is more important than our dashboard
While this might sound counter-intuitive to our first principle, high availability sometimes means we must make difficult choices. If a design must choose between the availability and function of the user-facing web interface versus the availability and function of our monitoring service, the monitoring service should come first. Obviously, every effort should be made to maintain the availability of the web interface, but this is secondary in importance to our monitoring system. An example of this decision can be seen in the way our Reaction processes handle database downtime.
Each component must be able to scale
When designing and developing for Runbook it is important to think about the scale of the changes you're making. Can these changes scale to thousands of users with thousands of Monitors? Could Facebook or Google use our product out of the box? With this in mind, we tend to keep Monitors and Reactions as stateless as possible and only utilize our Redis Cache and RethinkDB database for what is required to perform the action. However, we do sometimes need to store data for Monitors and Reaction states. When necessary, that data is stored in Redis with a timeout value. This approach ensures that even if we need stored data, it is only the latest data we need and will be purged automatically to avoid data bloat.
Keep it simple and stupid
This can be a difficult principle to follow when developing a complicated system such as Runbook, but we strive for simplicity. Sometimes, a developer may find themselves faced with a decision about whether to build a component with simplicity or functionality in mind. It is often better to design with simplicity, as simplicity will allow for a greater addition of functionality later. In addition, simplicity makes the production system easier to manage and easier to manage automatically.
Be modular
The Runbook application is designed to be modular as possible, and places where it is not are undergoing development to improve their modularity. By keeping the application modular we are able to add features easier and faster. This also has the benefit that new developers are able to add functionality without knowing and understanding the full application.
Components
Runbook currently has 4 major application components, monitors, actions, bridge and web. Each component is designed to be independently scalable. One component may be scaled without requiring other components to meet the same scalability.
Runbook Web
The Web component is the easiest component to understand. This is a simple Flask web application that serves as the user interface for creating Monitors and Reactions, managing a users subscription, and a dashboard for the current state of Monitors. In addition, the Runbook Web component also receives and processes Webhook Monitors. These are Monitors where services such as Datadog, PaperTrail, or Travis-CI notify Runbook of Monitor status.
Persistence
Runbook Web uses RethinkDB as its back-end database system. RethinkDB is a highly scalable JSON document database. We chose this database for several reasons.
- Provides out of the box synchronous replication and automatic failover
- Queries are automatically parallelized and distributed amongst multiple nodes
- Allows for scaling at both a local datacenter and cross datacenter level
Runbook Bridge
The Runbook Bridge application is designed to bridge the gap between the web front-end and the monitoring and reacting back-end systems. When Monitors and Reactions are created, the Web process stores them into the monitors or reactions tables within RethinkDB. The Web process also places a create, edit, or delete entry into the dc#queue tables within the database. The Bridge process is constantly reading from the dc#queue table and processing the entries placed within those tables.
Each dc#queue table is unique for each data center Runbook runs from. The Bridge process will only read from one of these tables, for multi-datacenter deployments there should be at least 1 Bridge process running per datacenter.
Since the Web process itself does not interact with the back-end monitors the dc#queue tables are used to relay tasks to the back-end systems. It is the Bridge system's responsibility to process those tasks.
When the Bridge process receives a create task it will read the Monitor or Reaction configuration from the database entry and store that data in that data center's local Redis instance. Each datacenter or "monitoring zone" within the Runbook environment has its own local Redis server. This Redis server is not replicated to any other data centers and is simply there to serve as a local cache for Monitors and Reactions running from that data center.
Note: If an issue was to occur where a local Redis instance was destroyed and unrecoverable, a new Redis server can be repopulated using the bridge/mgmtscripts/rebuild_redis.py script. This script reads from RethinkDB and creates edit requests within each data center's dc#queue. This will cause a re-population of each Redis instance in each data center. This is a benign process as RethinkDB is designed to be the source of truth regarding Monitor and Reaction configurations.
In addition to creation and deletion tasks, the Web process will also write Webhook Monitor events to all of the dc#queue tables.
Recovering from RethinkDB failures
When RethinkDB servers are experiencing issues, the RethinkDB instance may become read only until the offending node is automatically removed and other nodes are automatically recovered. During this time, Reactions are unable to write historical logs of execution since the instance is read only. When the instance is read only, processes will write logs to Redis. When the Bridge process is starting, it will read the Redis keys associated with these logs, process them and store this data into RethinkDB. This essentially becomes a write behind process.
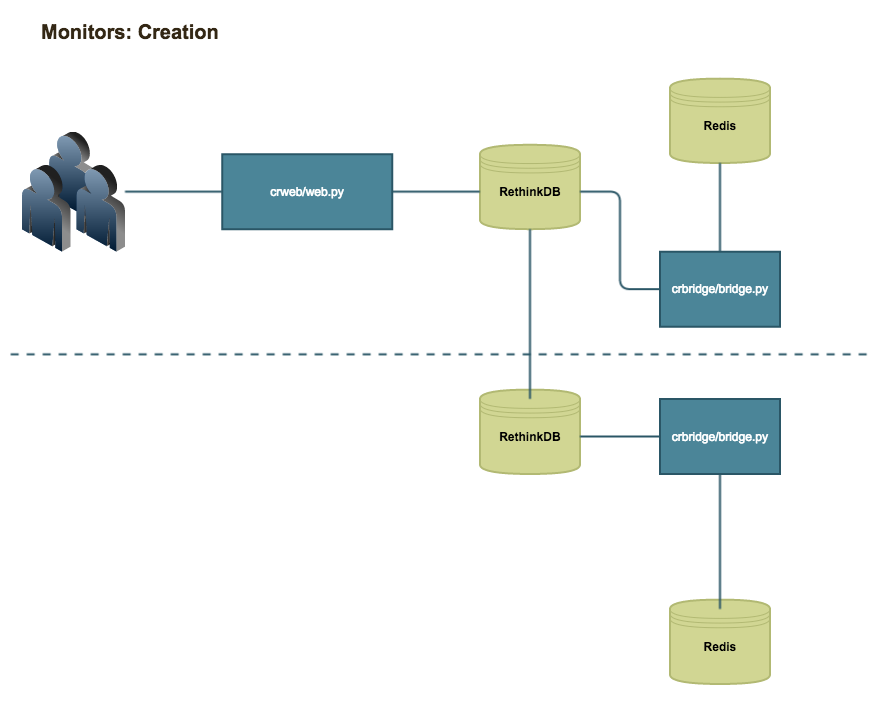
Monitor creation process
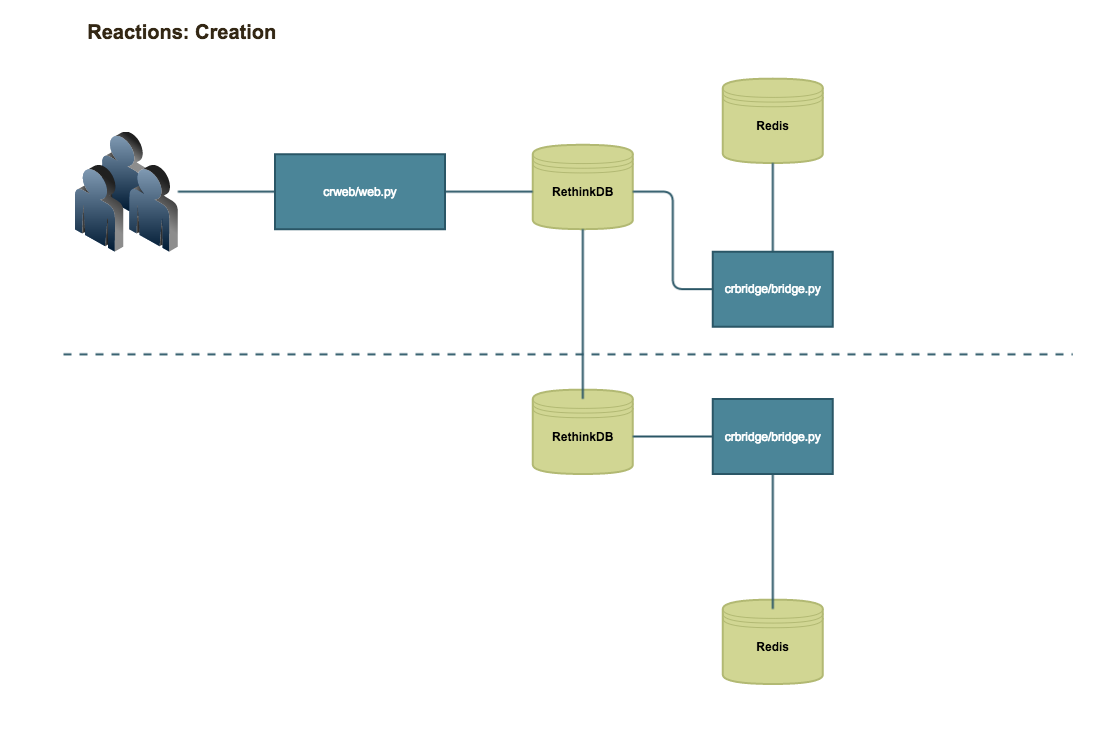
Reaction creation process
Runbook Monitors
The Runbook Monitors component is designed to perform the actual monitoring of remote systems. This component is comprised of 3 major programs: control.py, broker.py, and worker.py.
Control
When the Runbook Bridge process adds Monitor details into Redis, it looks at the Monitor details and extracts the interval value. This interval key is a queue. The Monitor's ID number is added to this queue which is essentially a sorted list within Redis. The interval defines how often the Monitors should be executed.
Below are the interval queues deployed with a default instance of Runbook.
5mincheck: this sorted list is for Monitors that run every 5 minutes1mincheck: this sorted list is for Monitors that run every 1 minute30seccheck: this sorted list is for Monitors that run every 30 seconds
These instances are defined in both the src/web/instance/web.cfg and src/monitors/config/control-*.yml configuration files.
The monitors/control.py program is a generic program that is designed to pull Monitor IDs from a defined sorted list in Redis (one of the intervals listed above). Once it has a list of Monitor IDs, it will loop through that list and look up the Monitor's details from Redis using the Monitor ID as a key. Once the Monitor's details are read, the monitors/control.py process will create a JSON message including the Monitor's details and send that message to monitors/broker.py using ZeroMQ.
Each monitors/control.py process can only read from one sorted list. In order to have all sorted lists monitored, each sorted list must have its own monitors/control.py process. This is possible because the monitors/control.py process receives all of its Redis and timer configuration from a configuration file.
Broker
The monitors/broker.py or Monitor Broker process is simply a ZeroMQ broker. The process binds two ports. One port is used to listen for ZeroMQ messages from the various monitors/control.py processes. The second port is used to send that received message to a monitors/worker.py processes.
Worker
The monitors/worker.py or Monitor Worker process is the process that performs the Monitor tasks. The code to perform an actual Monitor check is stored as modules within the src/monitors/checks/ directory. For example, the TCP Port Monitor is the module src/monitors/checks/tcp-check. When the Worker process receives a health check message from the Monitor Broker it decodes the JSON message and determines what type of check module should be loaded. It then loads the module and executes the check() function passing the Monitor-specific data to the function.
The check() function will return either True or False. With this result, the worker process will generate a JSON message which is then sent to the Runbook Action Broker.
Monitor execution process
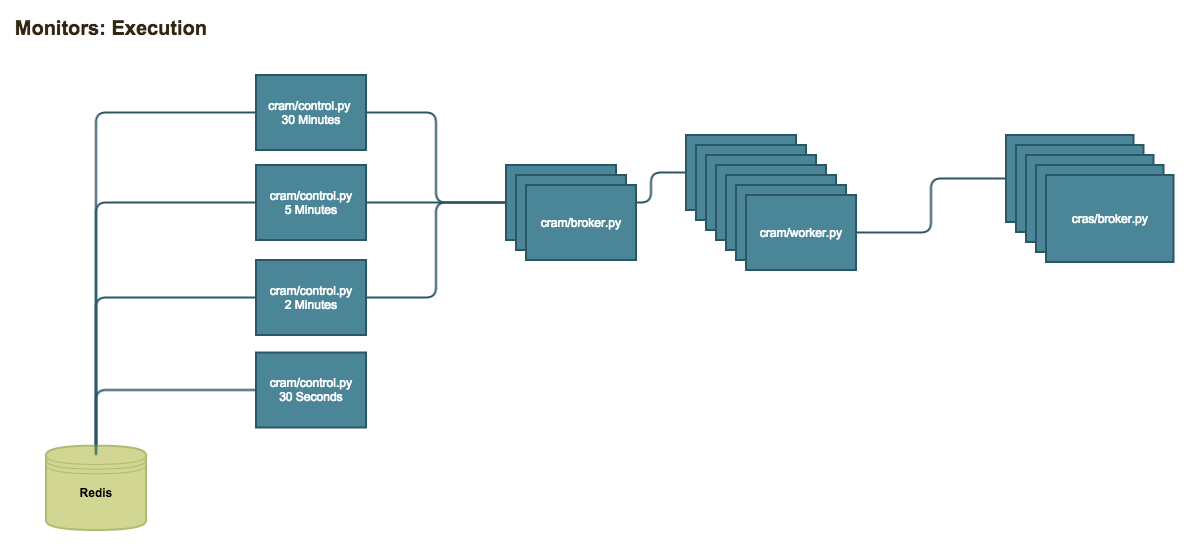
The entire Runbook Monitor application design is built to scale. The Worker processes are designed to run in large numbers. The Broker facilitates this, and by having each Control process route though the Broker each Worker is being fully utilized and able to distribute Monitor executions efficiently. The Control processes are the only singleton. While these processes are unique for each monitoring zone, It is simple enough to add monitoring zones as needed. If the performance of the Control process is unable to keep up with demand the answer is to simply add additional monitoring zones and influence which zones monitors are created against.
Runbook Actions
The Runbook Actions are designed to perform the "Reaction" aspect of Runbook's Monitoring and Reacting. Like the Monitors there are two main programs with Actions, actions/broker.py or Action Broker and actions/actioner.py or Actioner.
Broker
Like the Monitor Broker the Action Broker simply receives JSON messages from the Monitor Worker or Bridge processes and forwards them to a Actioner process. This facilitates the ability for multiple monitor results to be processed at the same time and from multiple machines. To scale the performance of Monitor result processing, multiple Action Brokers can be launched.
Actioner
The Actioner process is the process that performs Reaction tasks. Like the Monitor Worker, the code to perform a Reaction is stored within modules in the src/actions/actions/ directory. An example of this would be the src/actions/actions/email-notification module which handles email notification Reactions.
When the Actioner process receives the JSON message from the Monitor Worker process, it will first look-up the Monitor from Redis and then RethinkDB. If the RethinkDB request does not return a result due to a RethinkDB error, the Monitor is flagged as a cache-only Monitor. The idea behind this method, is that even if RethinkDB is down the Monitor should still be actioned to ensure that Runbook is providing its function of protecting user environments.
Each Monitor JSON message has a list of Reactions associated with that Monitor. After looking up the Monitor, the Actioner process will loop through these Reactions. The Actioner will look-up Reaction details first from Redis and secondly from RethinkDB, following the same process as the Monitor data look-ups. In this case, the Actioner will compare the lastrun time from both results and utilize the newest. This is to ensure that frequency settings within the Reaction are honored if the Reaction was executed from another data center.
When the Actioner process has the Reaction data it then loads the appropriate src/actions/actions/ module and executes the appropriate method for performing the Reaction. When Reactions are executed, a set of "meta" Reactions are also executed. These "meta" Reactions are essentially Reactions of Reactions, and are used to update the RethinkDB and Redis datastores as well as update any Reaction-tracking logs.
After all user-defined Reactions have been executed, a list of default Reactions are executed for the Monitor. These Reactions are similar to the "meta" reactions, but are reacting on the Monitor itself rather than the Reaction.
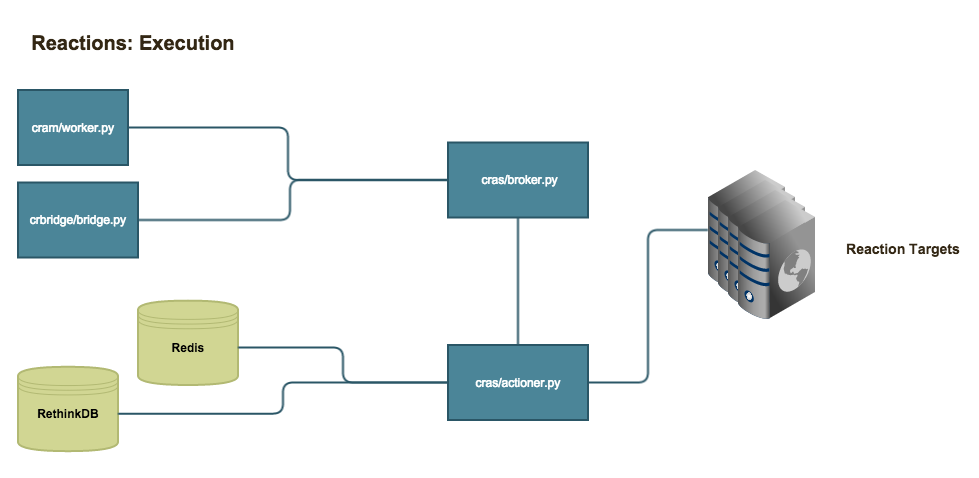
Reaction execution
Architecture Diagrams
Below are links to Architecture Diagrams of the Runbook environment. Each of these diagrams show a different aspect of Runbook's application environment.
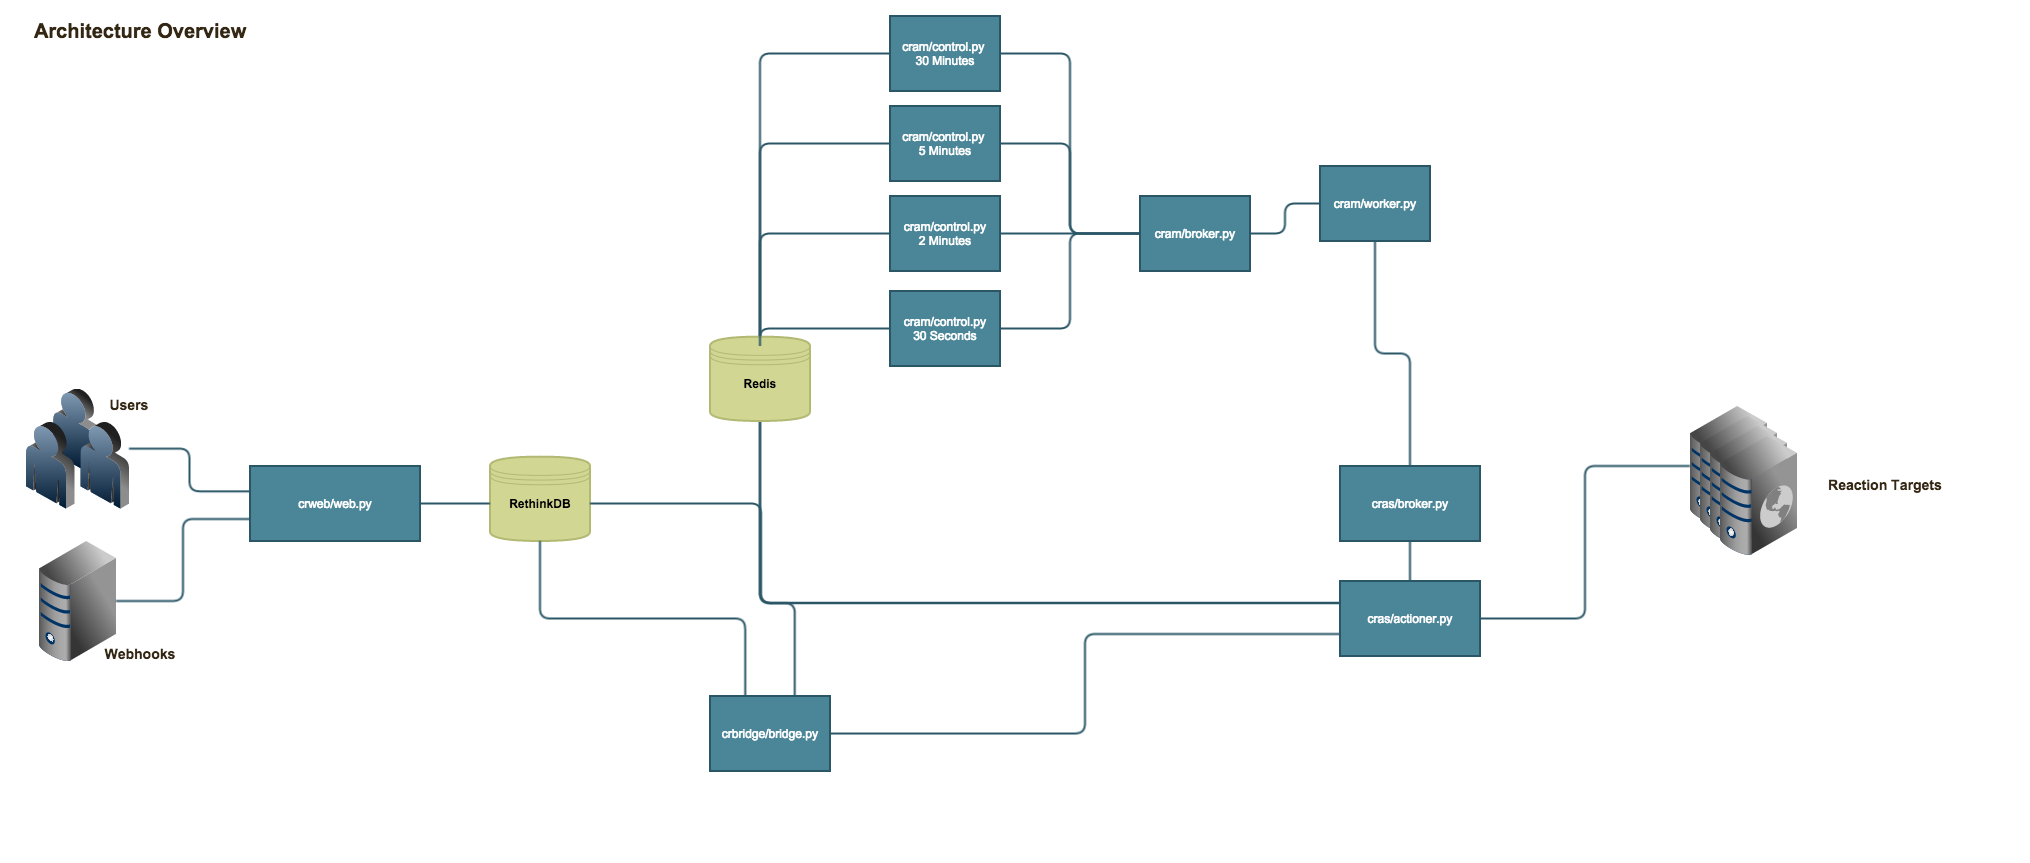
This shows a holistic view of each component and its interactions. This also depicts a typical development environment setup. You can think of this as the minimal required implementation.
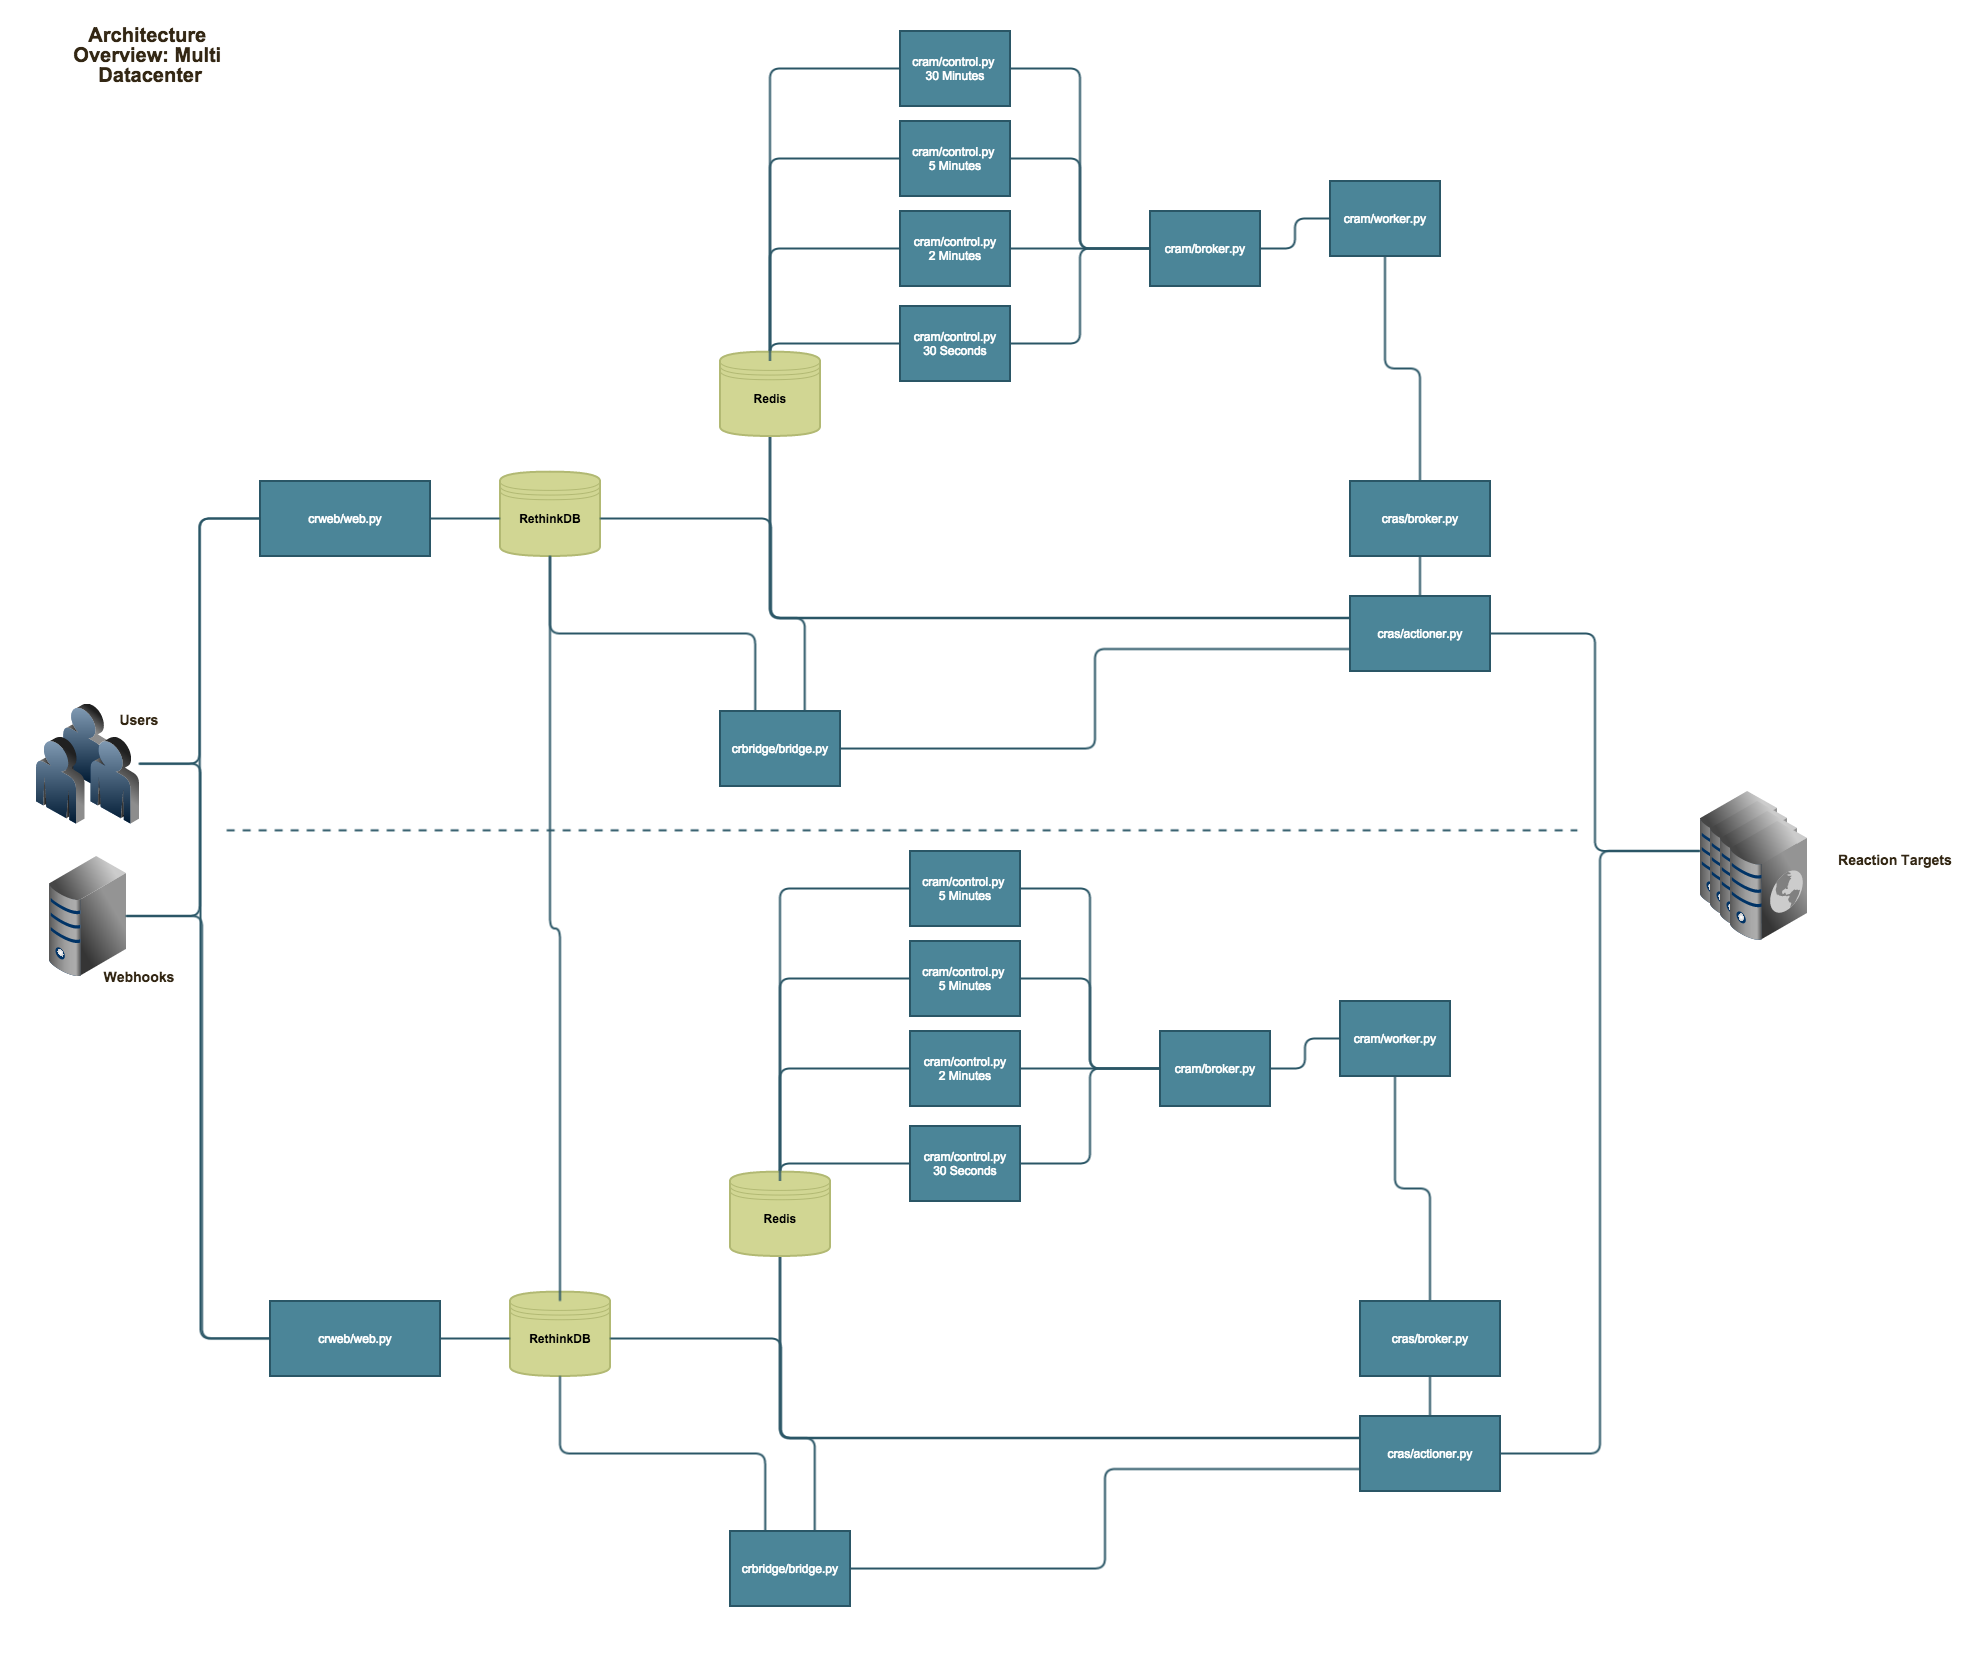
This diagram depicts each component and its interactions as it is deployed in two data centers. When considering this deployment, it is feasible for Runbook to be deployed across more than two data centers.
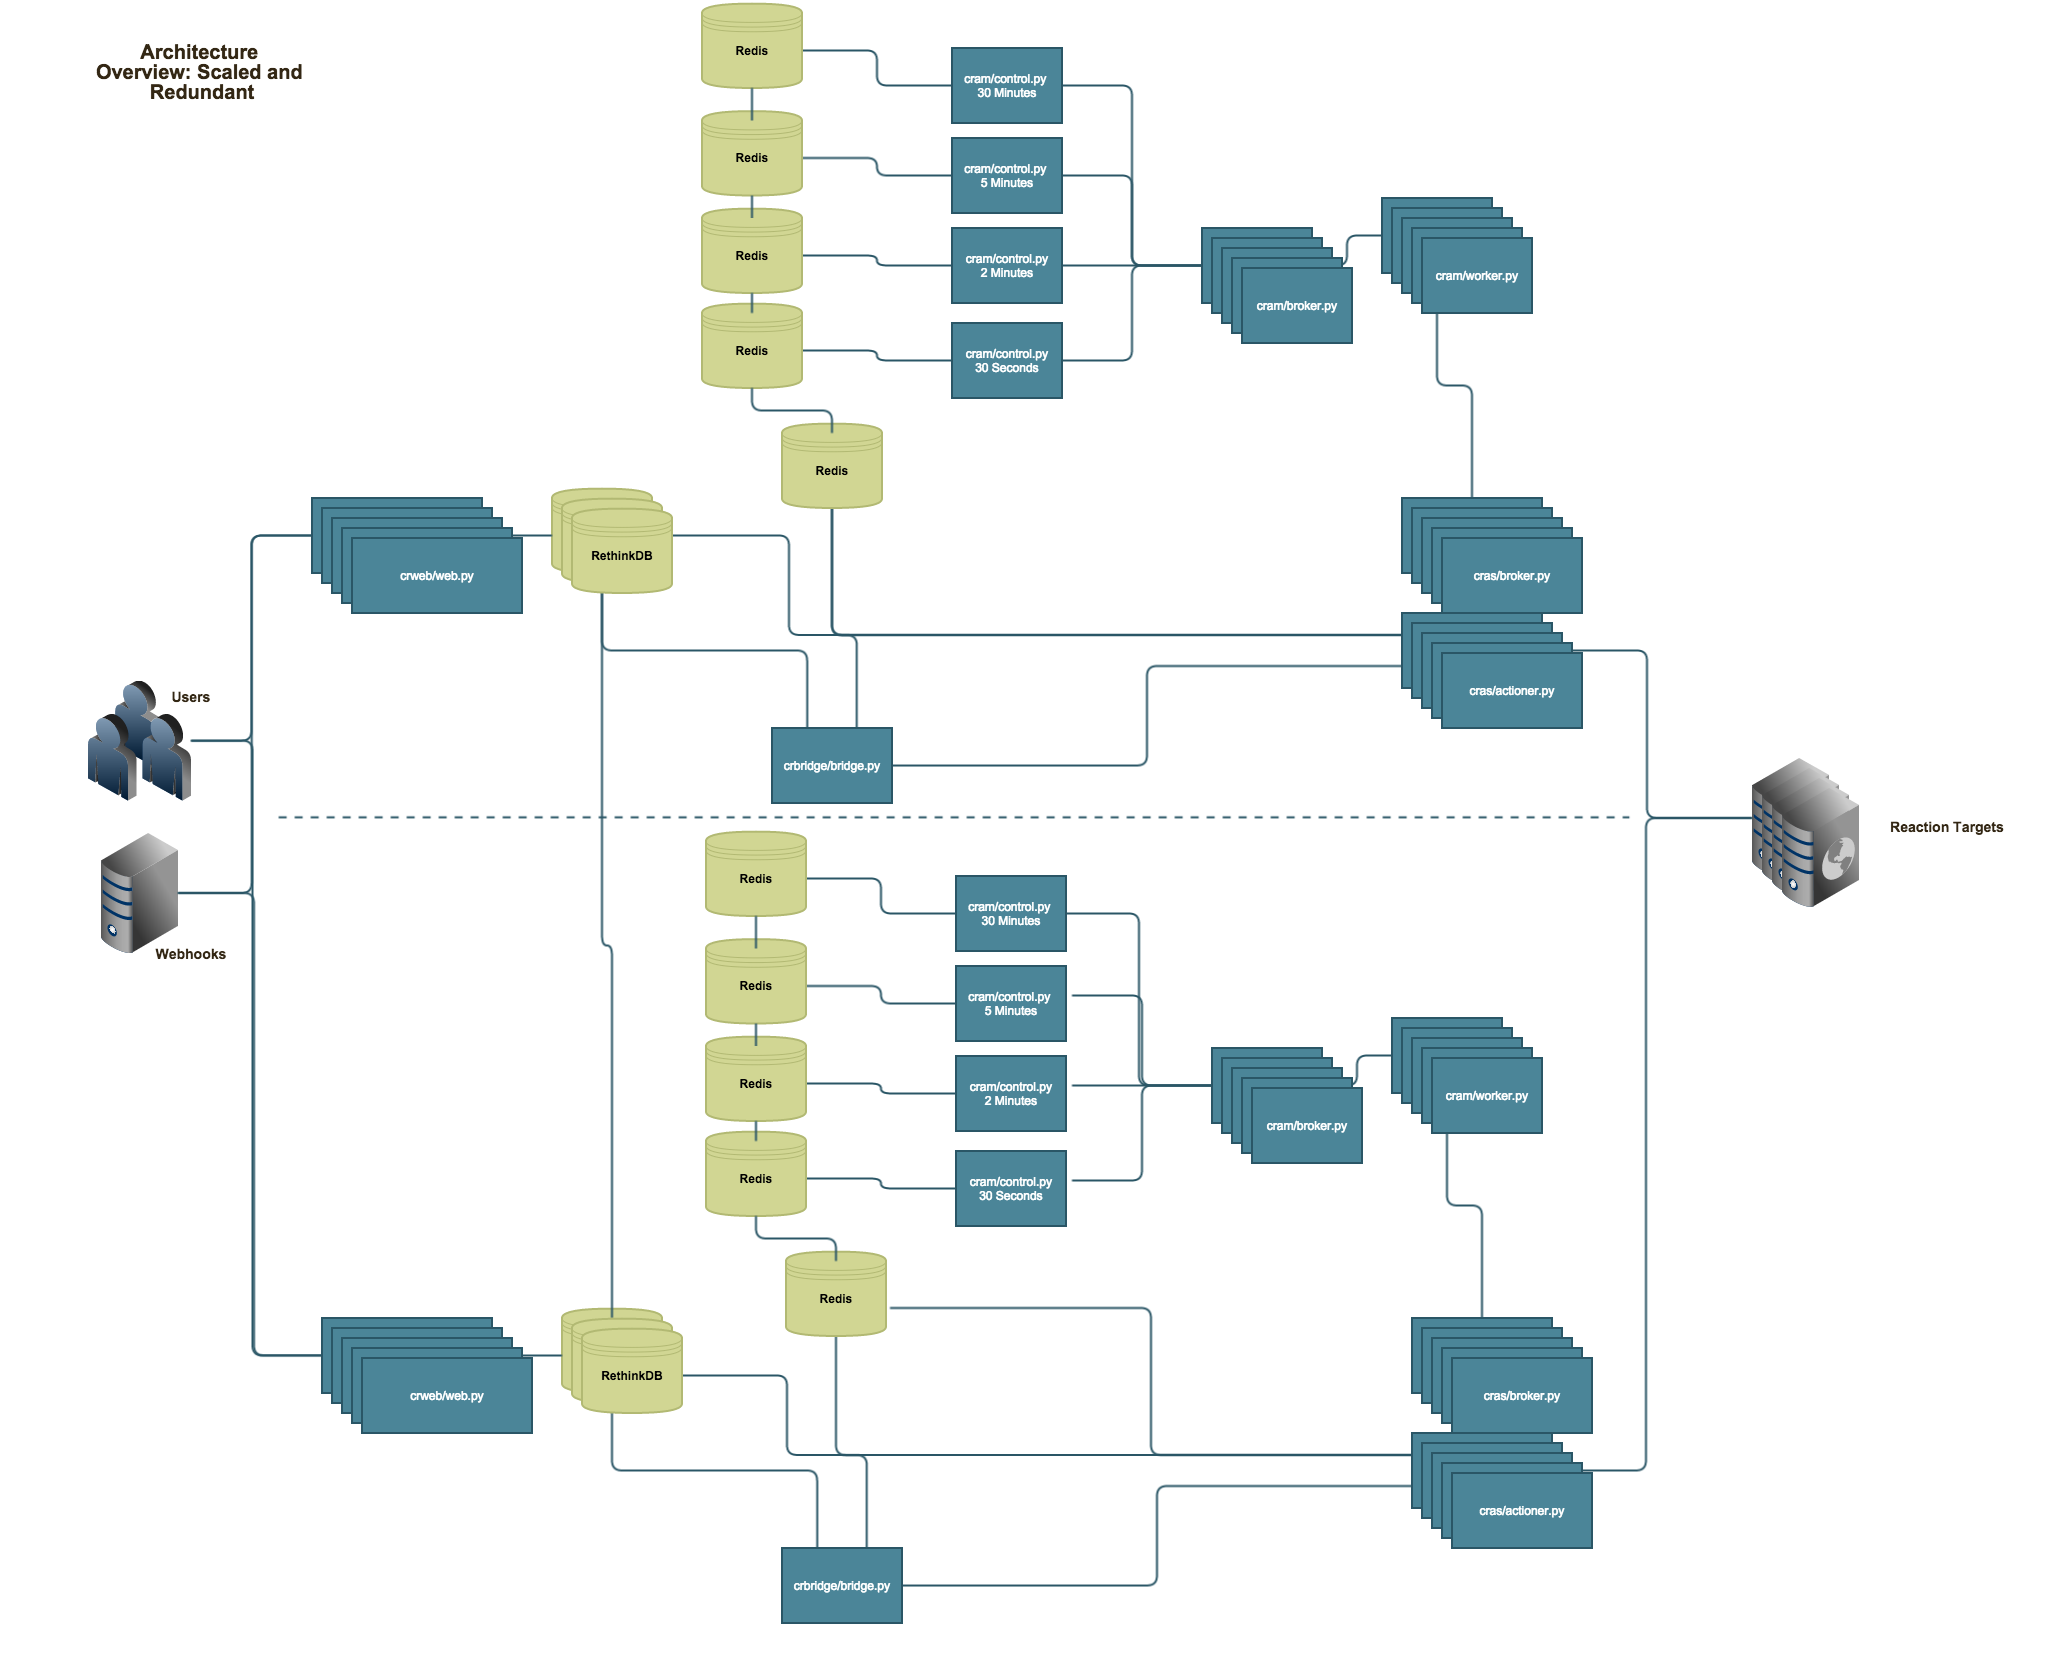
This diagram shows each component deployed in a highly scaled out and redundant design. Components with multiples can be scaled beyond the number depicted as needed. Components without multiples such as the control.py processes can expanded by adding additional monitoring zones. In theory, the Bridge component could support running multiple copies. However, this has only been used in ad-hoc cases for processing a backlog of requests.